Last week, Microsoft announced the availability of the Azure AD Content pack for Power BI. As with any other content pack, you are simply getting a curated, easy to use overview of the data that’s already available in the myriad of different log files, and a toolset to build any additional reports and visualizations. So let’s have a quick look.
To get started with exploring the Azure AD Content pack, all you need to do is login to the Power BI portal and press the Get Data button in the lower left corner of the screen. Then, click the Get button under services, or if you prefer use the direct link. Locate the Azure Active Directory Activity Logs card and press the Get it now link below. On the next step, you will have to provide the Tenant name, more specifically the domain you will be connecting to. Lastly, you will need to provide the credentials to be used in order to fetch the logs from said tenant. Use the default OAuth2 configuration and press the Sign in button, then follow the authentication prompts. The Azure Active Directory Activity Logs dataset will then appear on the left navigation menu, along with the prebuilt Dashboard and Reports.
The default Dashboard you get with the content pack is shown on the screenshot below. It includes visual representations of the number of sign-in events in the last 30 days and their corresponding geolocation, Unique users per App with Geolocation and a chart showcasing the usage of the Top 5 apps:
Clicking on either one of the dashboard tiles will get you to the Reports section, where you will get a table representation of the data and the relevant controls to filter and sort it as needed. It’s all of course tied in to the actual Dataset, which is the starting point for creating additional reports or customizations. We will explore an example of an custom Azure AD report later on, but as in this article we are exploring the actual Content pack and not PowerBI itself, we won’t go into more details on working with Reports here (there’s extensive documentation available if you need more information on them).
So, the Azure AD dataset includes the following:
- Application Usage – aggregated data by application and last sign-in date.
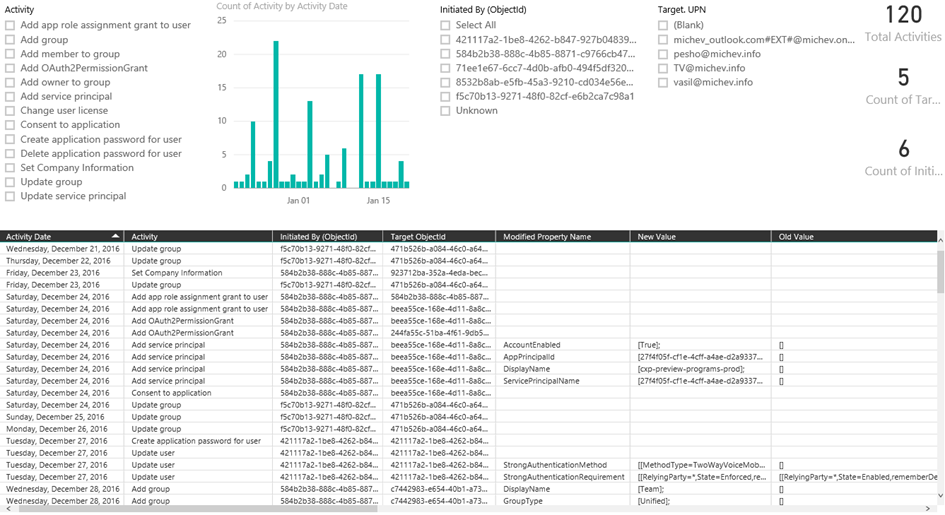
- Audit logs – all the administrative actions performed in the Azure AD instance. The default Dashboard or Report don’t expose this data, so make sure you don’t overlook it!
- Signin activity – all the logon events per date per application and some additional fields.
- Unique users – pretty much the same as the above.
- Unique user per application – lists each user that has accessed given application.
Compared to the 20+ reports we get under the Azure AD Reports section in the Classic Azure portal, it leaves a lot to be desired. Granted, some of the reports can be easily constructed based on the data already in the dataset, but things like the anomalous activity reports are simply missing. Which begs the question why the Content pack requires Azure AD Premium licensing if it does not include all the data you can get with AAD Premium?
Some other issues are easily noticeable with the Content pack. For example, every “unknown” city/location will be visualized on the map someplace in India, which can give you a little scare if all your users and data is located in the EU. Some events will return object IDs instead of the username and thus will not only look bad in the report, but will also skew it with additional entries. Same goes for UserPrincipalName data, especially in the case of Skype for Business. One should also be aware of some of the limitations of PowerBI – for example the table/matrix controls will not list duplicate entries unless you add an index column. The same issue will be affecting every file you try to export based on such Report, so to overcome this you might want to include fields such as the UniqueID one.
Still, those are hardly a deal-breaking issues and the Content pack can be of great value to you, especially when you modify it to best fit your needs. One can of course get the same data via the APIs or export I directly from the Azure portal, but things are simply easier with PowerBI. Anyway, here’s an example of modified version of the User Sign-ins Report that can easily be drilled down to give you events per user, application, IP address, date or login status:
The report above allows you to answer questions such as “who logged in from IP XXX and which application were they using” in a matter of two or three clicks. And here’s an example of a report of all the Admin activities:
As before, it’s easy to add slicers by date or activity type. Determining who performed the action and which object(s) were modified is a bit trickier however, as the relevant data is not always presented in a readable form in the dataset. One can of course rely on the ObjectId, however linking it to actual user/application/service name in the web UI is not possible. Instead, you would have to use the full data modeling experience available in PowerBI Desktop.
Still, it’s another example of the type of visualizations and insights you can get with the Azure AD Content pack and after you put some effort into it, the result will surely beat working with the raw data from the logs or using “pure” Excel functionality.


is this content pack still available? I am unable to find it.