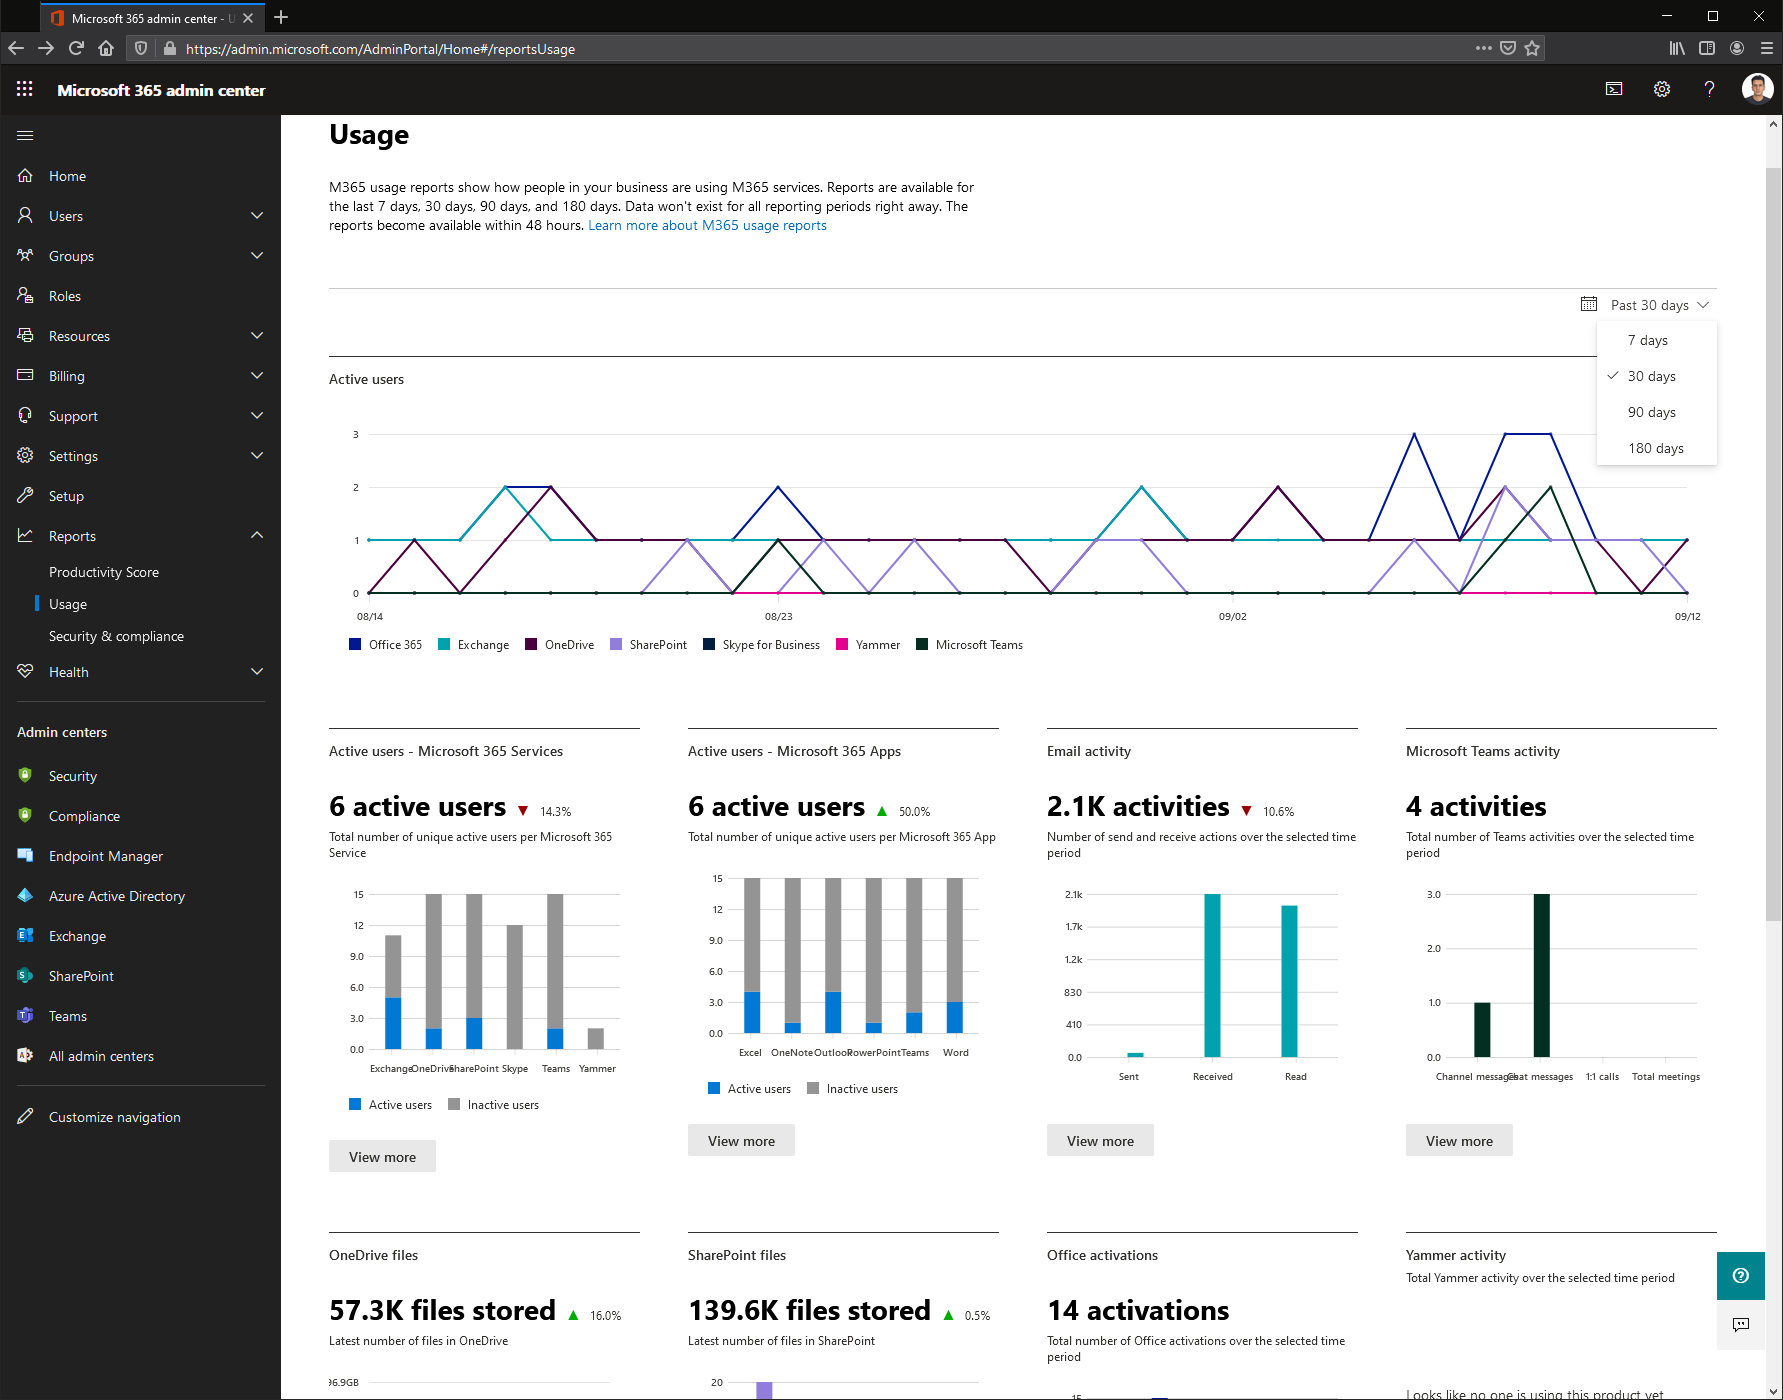
While doing some fact-checking against the reports page within the Microsoft 365 Admin Center earlier today, I noticed that we now have a new layout for it, as showcased below:
 Front and center, we have the Active users report in Graph form, showing activities across the different workloads for the past 30 days. While you can change the reporting interval using the dropdown in the top right corner, if you want to perform any other modifications or export the data, you should head over to the details page. Incidentally, there seems to be no way for doing so for the Active users report, apart from having to click on the View more button under any of the other report entries presented on the page and using the “switcher” there.
Speaking of which, the other tiles correspond to the following reports:
- Microsoft 365 active users (per service)
- Microsoft 365 App usage
- Email activity
- Microsoft Teams activity
- OneDrive files
- SharePoint files
- Office activations
- Yammer activity
- Forms activity
- Skype for Business activity
Lastly, a link to the Microsoft 365 usage analytics solution for PowerBI is presented.
Clicking the View more button under any of the above mentioned entries will take you to the corresponding “standalone” report page, which has the old look and feel. Nothing is changed in terms of functionality here it seems, so you can get all the familiar controls, including the “switcher” on top.
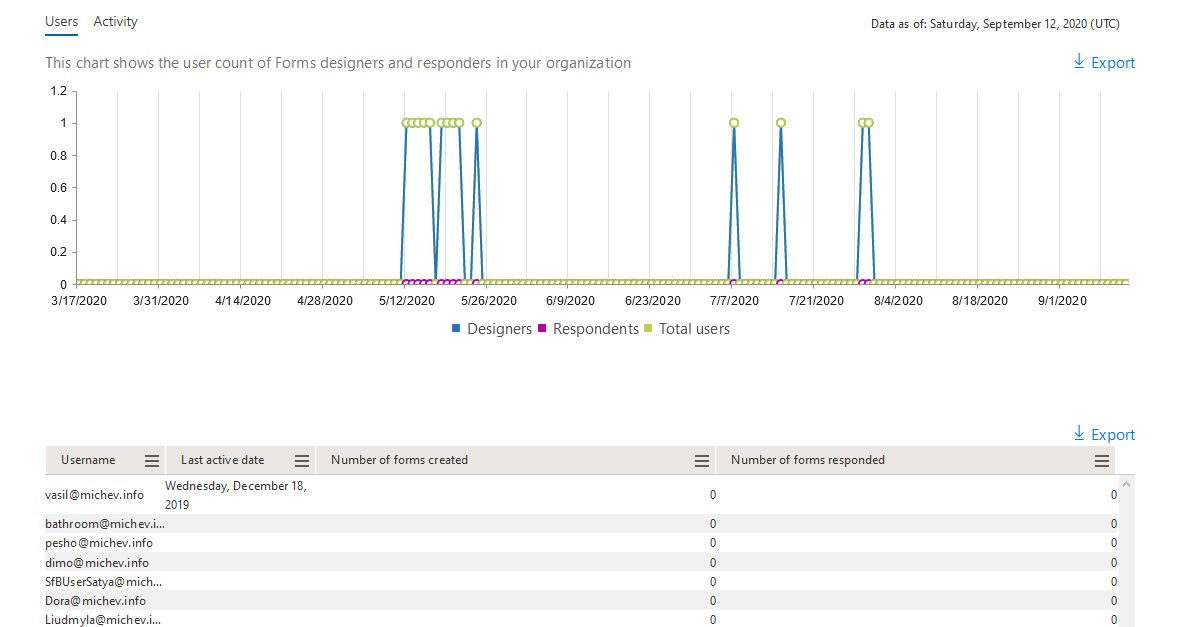
In other news, a new Microsoft Forms activity report has been added, which as the name suggests covers activities in Forms. The chart on top of the report page will show the number of users that have created or responded to a Form, while the activity tab should cover the total number of created and filled in forms, including those by anonymous users. The data seems to be a bit off though, as the table representation doesn’t match the graph above. For example, while I do have several forms created over the past few months, mostly for collecting questions for our V2 Exchange PowerShell webinars, my user is shown with last active date of 18 December 2019, and a count of zero for the number of forms created field.
 On the other hand, the graph representation seems to match the actual activities performed in Forms, including the number of responses by anonymous users. Since I haven’t seen any official announcement for this report yet, and there doesn’t seem to be a matching Graph API endpoint for it either, one can assume that this is still in beta/preview, so over time these issues should be addressed.