Reporting in Office 365 has always been an area that leaves a lot to be desired, and things didn’t exactly improve with the introduction of Microsoft Teams. In fact, while several sets of reports, analytics and insights have been made available to help customers understand their Teams usage, multiple challenges exist.
For example, the spread of data between the Microsoft 365 Admin center reports, Teams Admin center reports, in-client analytics, PowerBI and more. In addition, the data across all of these is often times in disagreement, as they use different sources or presentation. Microsoft has since acknowledged such discrepancies and promised to provide “uniform” experience across endpoints.
This only solves part of the issues though, as one still needs to rely on multiple sources from different endpoints in order to get the full picture. For example, the “Teams usage” report is still only available via the TAC, whereas the “Teams” reports in the M365 AC only feature the per-user or per-device datasets. So, in order to get per-Team usage data, such as the all important “is this Team active”, you are forced to use the TAC reports. Within the M365 AC, all you can get is the “Groups activity” report, which can give you an indication as to whether the underlying M365 Group is utilized for email, file sharing or Yammer posts, but doesn’t expose actual Teams usage. So in order to get the full picture, you need to use multiple sources.
Apart from the difference in how said reports are accessed and generated, the main challenge here is the lack of API endpoints. Whereas every (or is it most?) report exposed within the M365 AC has a matching Graph API endpoint, none of the TAC reports (nor the in-client analytics) were accessible outside of the portal, making it impossible to automate reporting. Scheduling reports, emailing them to specific addresses, aggregating data across business units or even tenants, correlating with data exposed from additional reports and sources are all scenarios made available only when the corresponding API endpoints exist, so yes, this is a big deal.
And thankfully, Microsoft is now releasing the first set of Graph API endpoints that expose some of the TAC reports data. At the time of writing this article, this includes the set of endpoints representing data from the Teams usage report, as follows (snapshot below is from the Graph API metadata document, in case you are wondering):
<Function Name="getTeamsTeamActivityCounts" IsBound="true">
<Parameter Name="reportRoot" Type="graph.reportRoot" />
<Parameter Name="period" Type="Edm.String" Nullable="false" Unicode="false" />
<ReturnType Type="Edm.Stream" Nullable="false" />
</Function>
<Function Name="getTeamsTeamActivityDetail" IsBound="true">
<Parameter Name="reportRoot" Type="graph.reportRoot" />
<Parameter Name="date" Type="Edm.Date" Nullable="false" />
<ReturnType Type="Edm.Stream" Nullable="false" />
</Function>
<Function Name="getTeamsTeamActivityDetail" IsBound="true">
<Parameter Name="reportRoot" Type="graph.reportRoot" />
<Parameter Name="period" Type="Edm.String" Nullable="false" Unicode="false" />
<ReturnType Type="Edm.Stream" Nullable="false" />
</Function>
<Function Name="getTeamsTeamActivityDistributionCounts" IsBound="true">
<Parameter Name="reportRoot" Type="graph.reportRoot" />
<Parameter Name="period" Type="Edm.String" Nullable="false" Unicode="false" />
<ReturnType Type="Edm.Stream" Nullable="false" />
</Function>
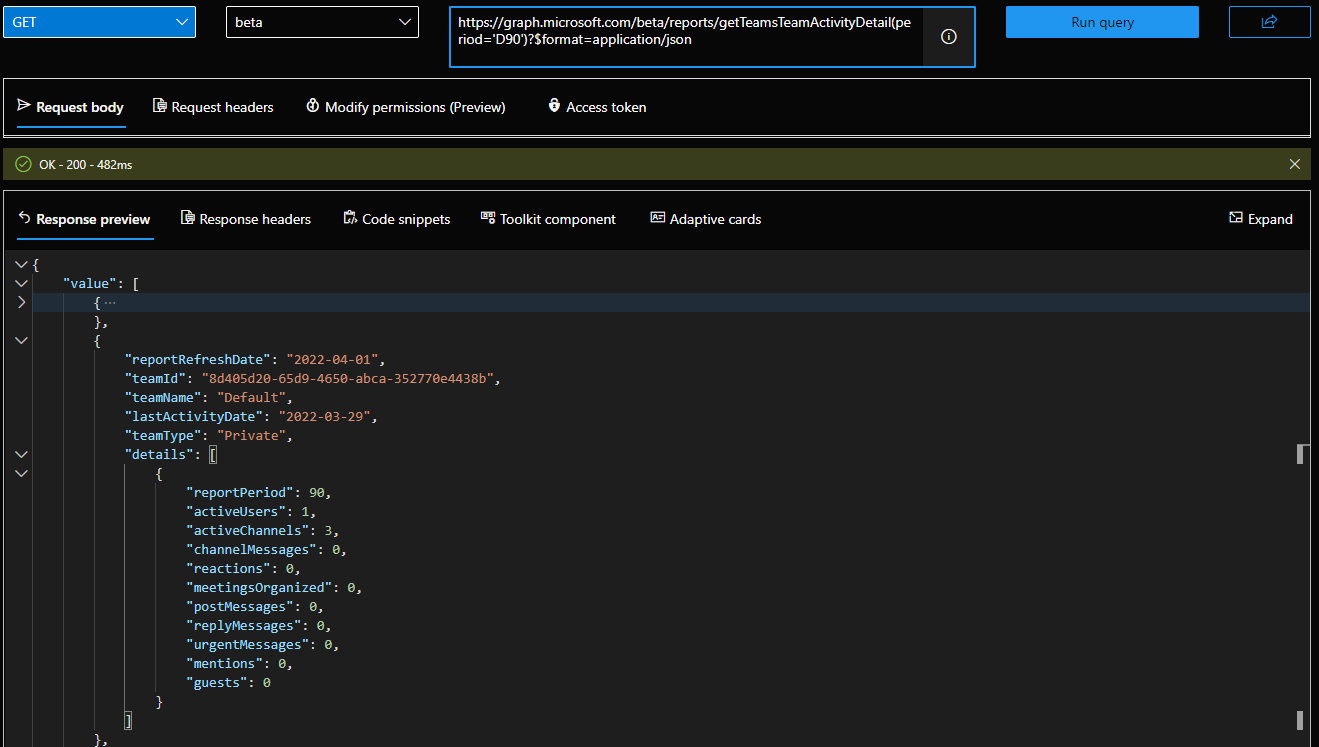
While the corresponding documentation is yet to be published, the bits above are sufficient to construct a query. For example, to get the “detailed” data from the Teams usage report, one can use the getTeamsTeamActivityDetail endpoint, for either a specific date, or one of the pre-built periods (say 90 days). We can also request the data to be returned in JSON format instead of CSV, by adding the $format=application/json statement. Lastly, note that the endpoint is currently only available under /beta. In effect, the corresponding Graph API query looks like this:
https://graph.microsoft.com/beta/reports/getTeamsTeamActivityDetail(period='D90')?$format=application/json
The screenshot below illustrates obtaining said data via the Graph explorer tool. Of course, in a one-person tenant such as mine, you shouldn’t expect to see anything interesting.
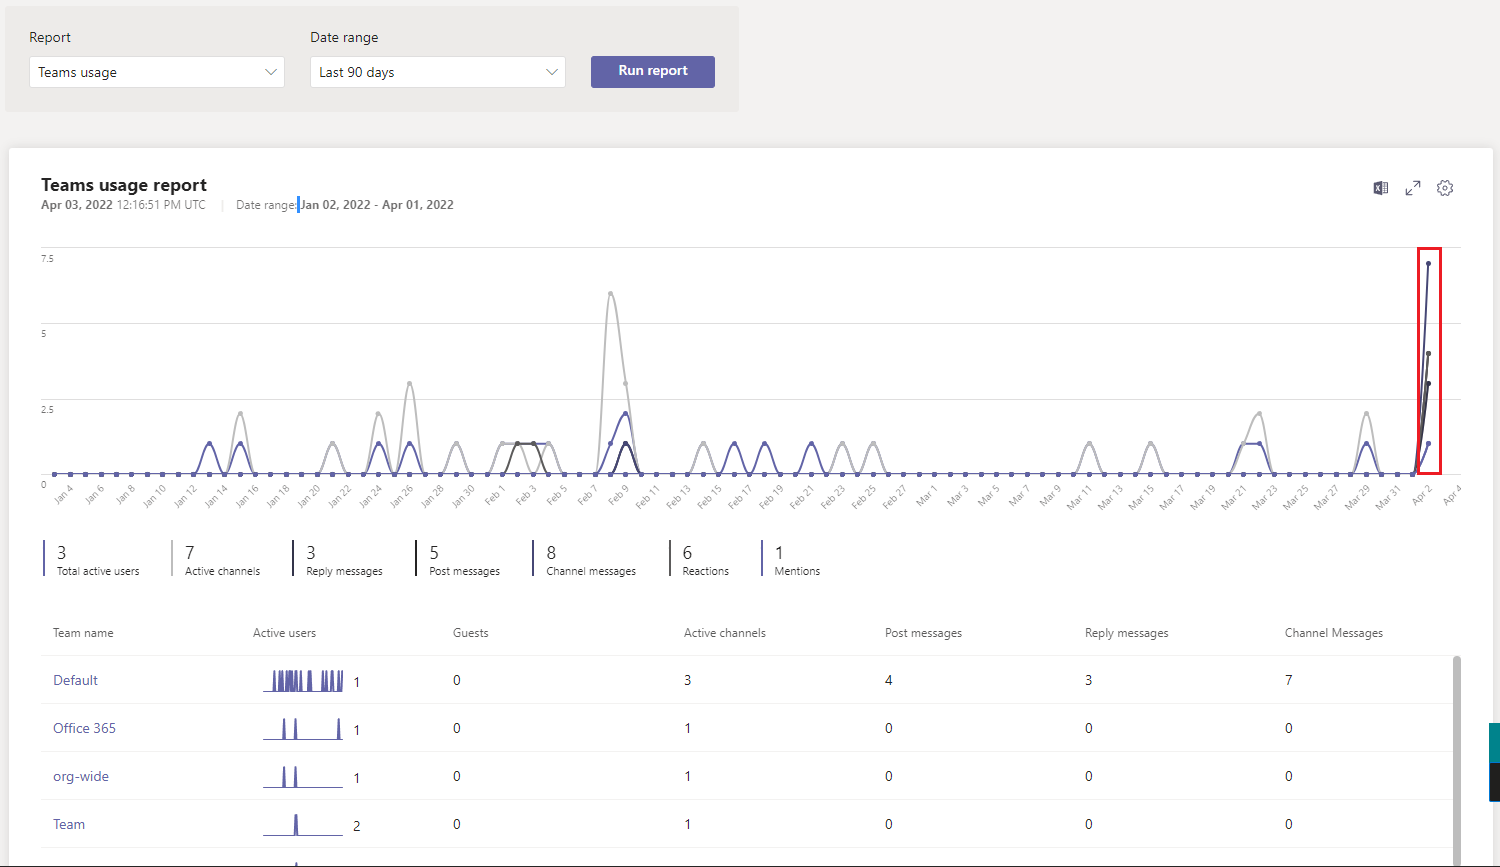
 The important thing is that data is actually obtainable outside of the Teams admin center now, and matches what we see inside the TAC for that matter. The latter statement might not be necessarily true, because as customary the Graph API reports data is lagging few days behind. Thus, the TAC still presents “fresher” view, with all the activities I performed yesterday, whereas the Graph API query returns data as of April 1st.
 Still, the fact that the Teams usage reports data is finally exposed via the Graph API calls for a small celebration. It shouldn’t take long for Microsoft to mature this to the /v1.0 endpoint and surface the corresponding report in the Microsoft 365 Admin Center as well, thus finally giving us better options to report on Teams activity!
Post was really helpful. Thanks. I see only 200 results are provided while using content-type application\json and when you put a while loop to go through remaining @Odata.NextLink the request is getting throttled in few seconds. Any idea how to overcome the 429 throttling error in teamsusage graph report?
Best wait until they release it in /v1.0