The new “specialist” Compliance and (separate) Security consoles have been available for Microsoft/Office 365 customers for a while now, but even though they are in “GA” status, there’s a lot of functionality missing compared to the good old Security and Compliance Center. This should hardly come as a surprise, given the way most teams within Microsoft release features.
One such glaring example was the lack of the Audit log search functionality, which is just now made available in the Compliance center. There are some minimal changes in the UI that might be used as an excuse of why such important feature took that long to be ported, but on the positive side, it does give me something to write about. So let’s take a quick look at the Audit page (yes, that’s how it’s called now, just Audit).
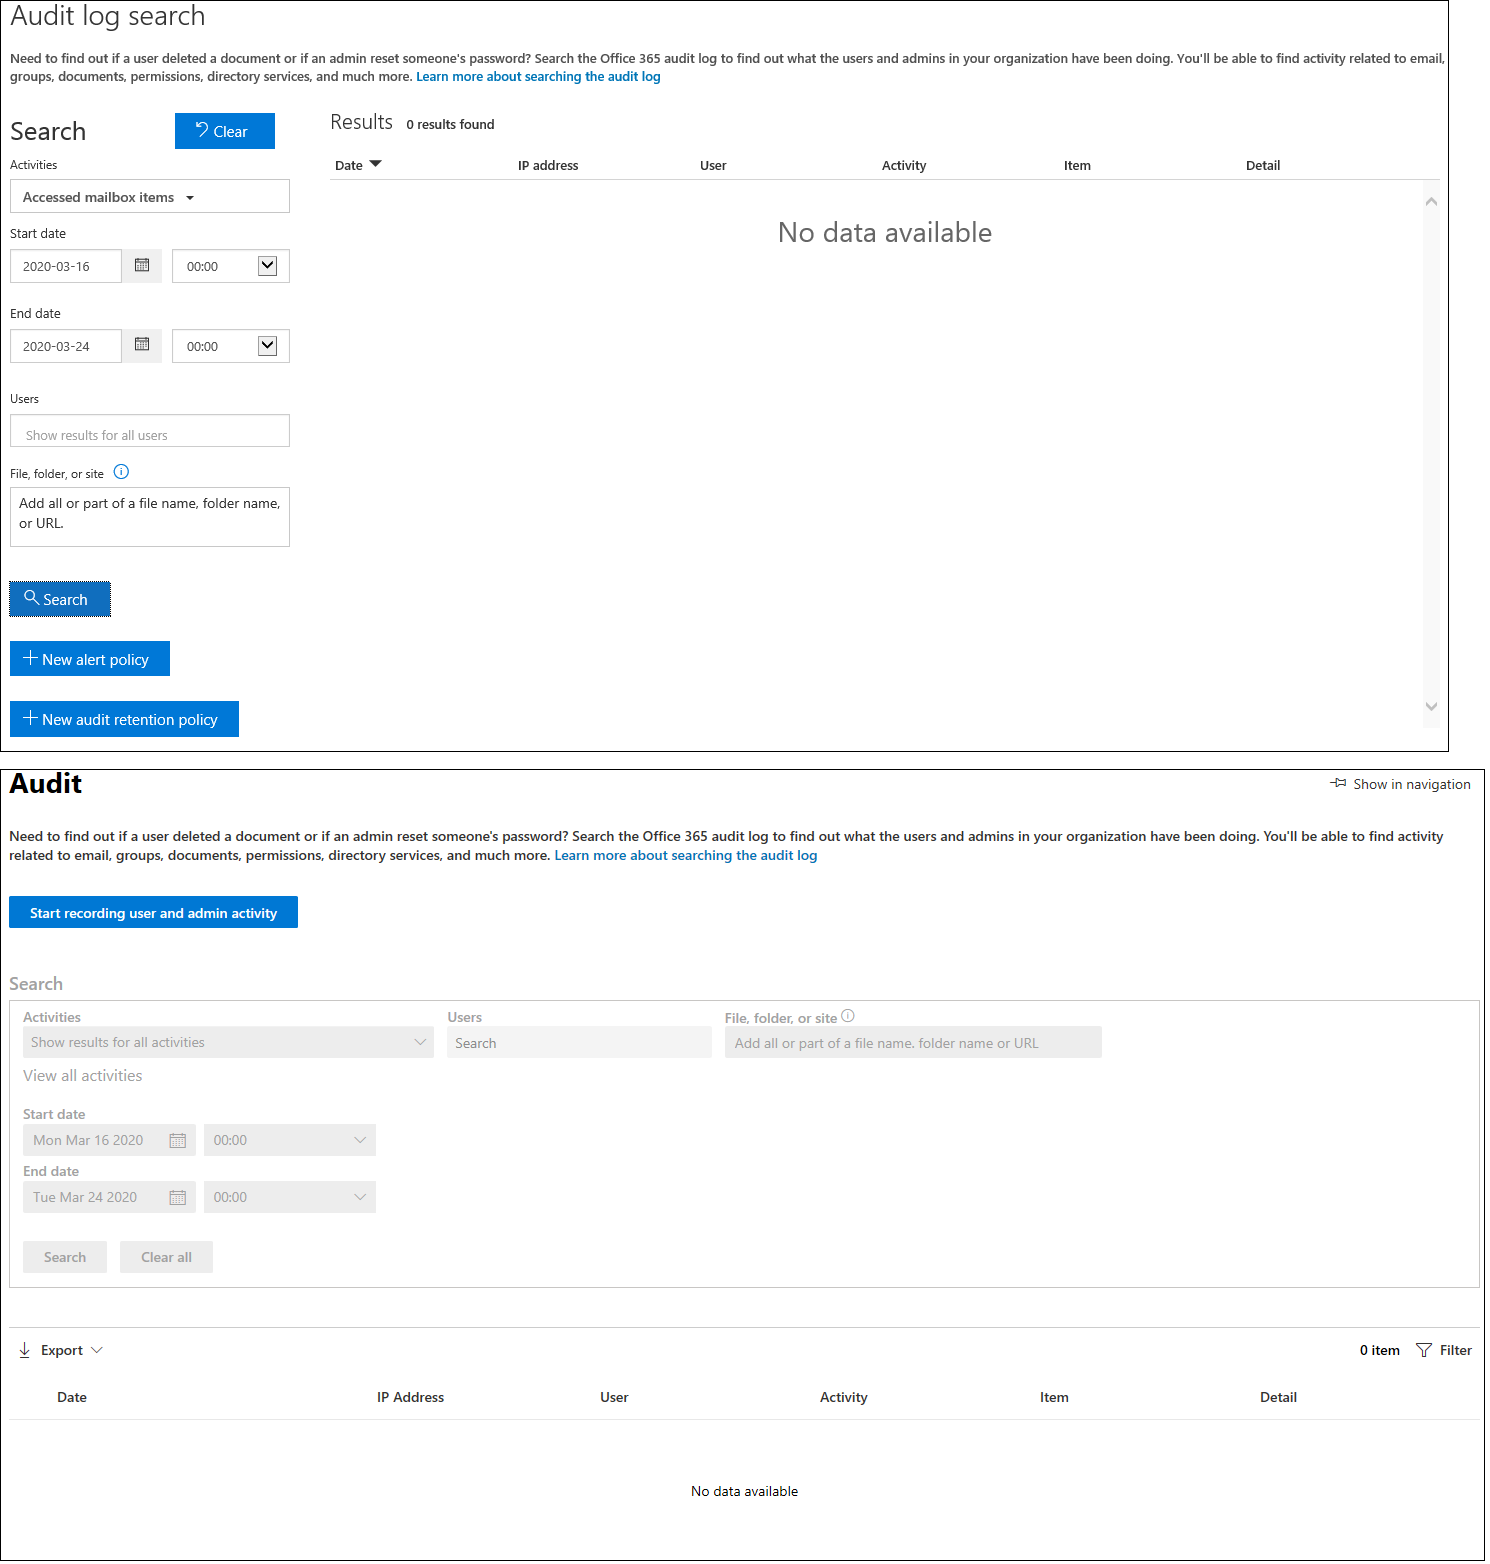
To access the Audit page, open the Compliance Center, then on the left hand side click the “Show all” button on the bottom, then hit “Audit”, or use this direct link: https://compliance.microsoft.com/auditlogsearch. The UI will look familiar to anyone that has used the Audit log search feature in the SCC, with the controls simply rearranged in a different manner. For comparison, here are the corresponding looks for the “old” (SCC, top) and “new” (Compliance center, bottom) UI:
One of the differences is that while previously a yellow notification bar was displayed on top if audit log collection was not yet enabled for the tenant, now you will see the Start recording user and admin activity button. In addition, all the other UI elements will be disabled, whereas the SCC UI still allowed you to play with them, and generated errors upon executing any search.
The rest of the controls work in a similar way to that of their SCC counterparts, with some bits improved to use the “styling” of the new UI. For example, the date selection fields feature easier selection for the year, similar to that we’ve seen in other parts of the “modern” portal(s). Possibly the biggest change here is the Activities dropdown, which now lists everything in a single column, taking a little longer to scroll down to the events you need. The search functionality is still the preferred method to narrow them down, given the number of entries currently exposed, but in situations where you don’t know the actual event name, you still have to scroll the list.
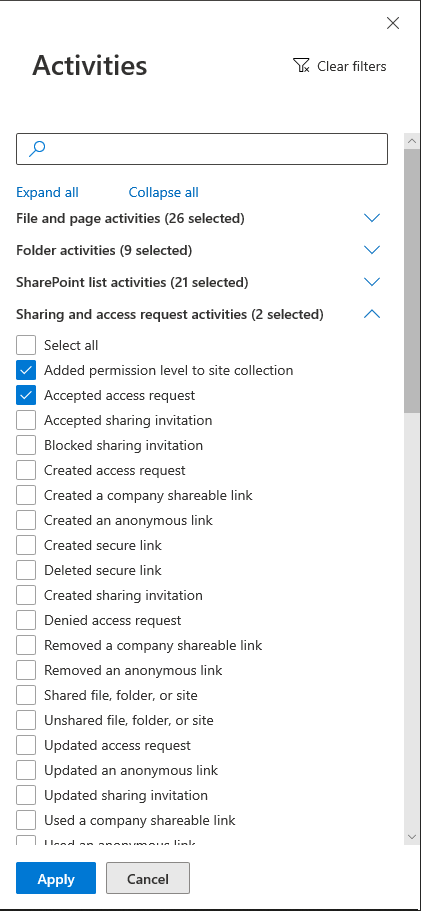
In addition, selecting all event types for a specific workload by clicking the corresponding “workload name” entry is no longer possible from the dropdown. For such operations, you can rely on a newly introduced pane, surfaced by clicking the “View all activities” link. There, you can click the “Select all” entry under each group to include all events from a given workload, or search for/select individual entries as needed. The number of selected entries is shown next to each section, but you don’t get to see the total count, and yes, limitations still apply here. You can also use the “Expand all”/”Collapse all” toggles to quickly navigate the list of entries.
Hovering over the Activities dropdown will bring up a tooltip with all the currently selected events, which might be used to get them all at a glance and should be easier compared to scrolling the entire list.
Apart from the minor UI adjustments, the Audit (log search) functionality works in pretty much the same way as in the SCC. The list of matching events will be populated below the selection controls, and you can click each entry to get additional details (which brings forth the same pane used in the SCC). Up to 150 results will be loaded by default, with more populated as you scroll down the list. You can use the Export button to get a CSV file with the details for the currently displayed events, or get all matches for the selected criteria.
The Filters button which previously brought forth “client-side” filtering capabilities is replaced with a nav pane too. While it does look easier on the eyes, the downside is that results are no longer filtered client-side first and instead are refreshed from the service, making the Filter controls behave in the same manner as the selection controls above. In addition to the longer loading times caused by this, you can no longer do things like filter by say “Service Account” for the user entry, as the corresponding control only accepts entries that can be resolved against users within the tenant. Another example where this fails is for narrowing down events that are not listed in the selection dropdown, for example when you want to filter by given Exchange cmdlet, say Set-Mailbox. So you’re bound to export the results to CSV and filter them there, which is probably the better experience anyway.
Speaking of missing functionality, the ability to create an Alert policy directly from a selected event is not currently available. The same applies to the recently introduced audit retention policies, which control the retention duration for different event types as we covered in a previous article. But since this is the first iteration of the feature in the new Compliance console, we should expect Microsoft to address these shortcomings over the next weeks/months.

