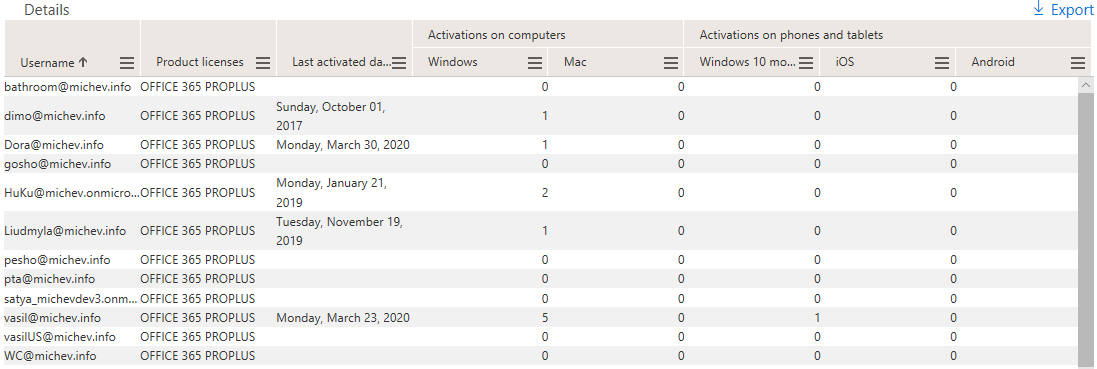
While there are a number of reports readily available within the Office 365 Admin Center, getting useful data out of them is not always that easy. Take for example the “Office 365 activations” report, which is intended to give you details about usage of the Office suite in your organization. As the name suggest however, all it really does is to show you which users have activated Office, but whether they are actually using it remains a mystery.
Here’s an example from my own tenant, where a qualifying license containing the Office Pro Plus subscription has been assigned to dozen users or so. Since this is a personal/test tenant, you can expect some oddities, like the fact that some shared/room mailboxes appear in the list, but that’s something I myself am to blame for. What’s more important though is that the actual data is somewhat incomplete or at times misleading. For example, we have a user which last activated Office back in 2017, does this user actually use the product though?
Enter the latest addition in Office 365 reporting. Dubbed “Office 365 ProPlus usage”, this new report gives us a breakdown of the activities for a given user across various Office applications and modalities, correlated to the last Office activation date. Which in turn allows you to extract more useful information out of the report. You can access the new report under the Office 365/Microsoft Admin Center -> Reports -> Usage -> Office 365 -> ProPlus usage or by using this direct link: https://admin.microsoft.com/Adminportal/Home#/reportsUsage/ProPlusUsage.
Here’s how the new report looks in my tenant with the default settings:
Some discrepancies are still noticeable, for example that same user that had last activated Office back in 2017 is shown as having a last activity date in Feb 2020, but no actual activity across the desktop, Mac, mobile or Web versions of Office. Further look into the Unified audit log shows no entries at all for said user, which doesn’t make things any clearer. Same lack of details on the activities can be found for the user “HuKu”, which shows as last activity date but no indication where this activity actually took place. The unified audit log however reveals that the user did log on to Outlook on the web on 29 Feb 2020 and created few mailbox items. So, in this case the last activity date is correct, however the corresponding fields for the “web” activity are blank.
At this point you might be thinking that this new report is not very reliable. However, I missed to mention one important detail above. Unlike the Office 365 activations report, and similar to the other “usage” reports in the portal, the Office 365 ProPlus usage report is generated for a specific time range. In turn, the data presented in the table reflects just the selected time range, which can either be 7 days, 30 days, 90 days or 180 days. The last activity date field will not reflect the time range selection though, which can cause confusion. Add to it the fact that the Unified audit log doesn’t capture any usage information from the desktop Office apps nor the mobile ones, and you have an explanation of the behavior observed above.
So, in case you see any instances with last activity date is over the default range of 30 days, make sure you adjust your time range selection on top, or just ignore this field and rely on the data presented in other columns. Speaking of which, you can add a number of these by pressing the column menu, or you can simply hit the Export button to get a CSV file containing all the available fields. Those include activities in Outlook, Work, Excel, PowerPoint, OneNote and Teams, across Windows (desktop), Web, mobile and Mac, in total 24 individual activity fields! Add to those the “aggregate” values for each individual app or platform, and you have tons of data to work with. Here’s how the table looks like in my tenant with the full column range and a time span of 180 days:
Microsoft can certainly do some work on the readability of the above table, by making it resizable to fit larger screens or at the very least by adding tooltips to the column names. But regardless, the actual data is what’s important and you can get that via the Export function. Doing so clears the mystery for our example user, the first one with some activity registered on the desktop version of Word in the past six months (again, not captured by the unified audit log), and the second one correctly showing the activity in Outlook on the web, as confirmed by the unified audit log.
So there you have it, the new (and not so shiny) report on Office 365 ProPlus activities in the Office 365/Microsoft 365 Admin Center. While there are some issues with the presentation layer, the report itself is rich with data and will certainly prove very useful for organizations trying to asses just how effective their Office license allocations are. Unfortunately, no Graph API endpoint seems to be available yet, so for the time being programmatic access is not possible.

