Ignite 2017 is long over, yet I’m still finding some interesting bits of information or feature announcements that I have somehow missed. One of the best examples is the session Carolyn Liu and Khushru Irani did on “Office 365 mail flow insights“.
In this session, among lots of other useful things, a short demo of the new Message trace UI was shown. The Message trace functionality is now homed in the Security and Compliance Center it seems, and thus it uses the same design elements. As the feature is still in development, no link is exposed on the left navigation menu, however some tenants seem to already have access to it via the following link: https://protection.office.com/#/messagetrace
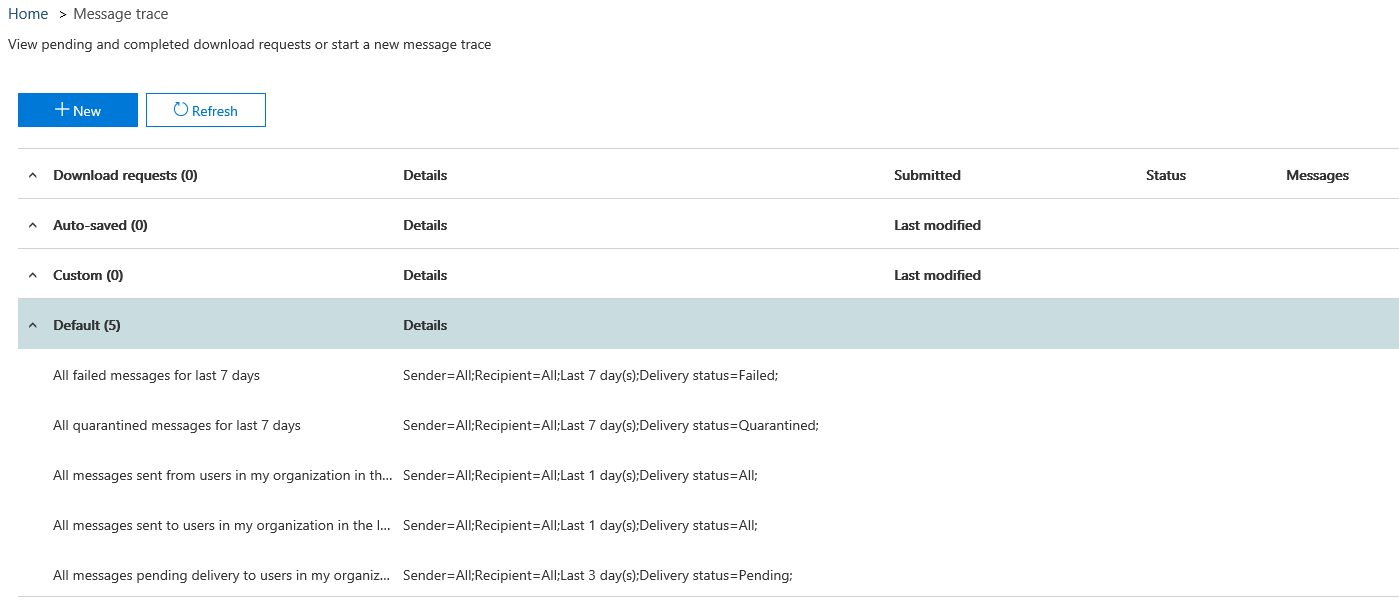
For those of you that do not have access, here’s how the “landing page” for the new Message trace UI looks like:
Now, what you see on that page is basically some predefined “reports” as well as any custom ones you have “saved” and a list of the 10 most recently run Message trace reports (“auto-saved”). In addition, if you have requested a detailed message trace report, any queued/completed downloads will show up in the first section.
To run a new Message trace, press the New button and simply enter the criteria. Not much has changed here and we pretty much have the exact same options as exposed by the Get-MessageTrace cmdlet. It’s all packaged with a new look and feel, and in general it’s a lot more intuitive. If you want to get the list of all the messages, simply press the Search button without entering any criteria.
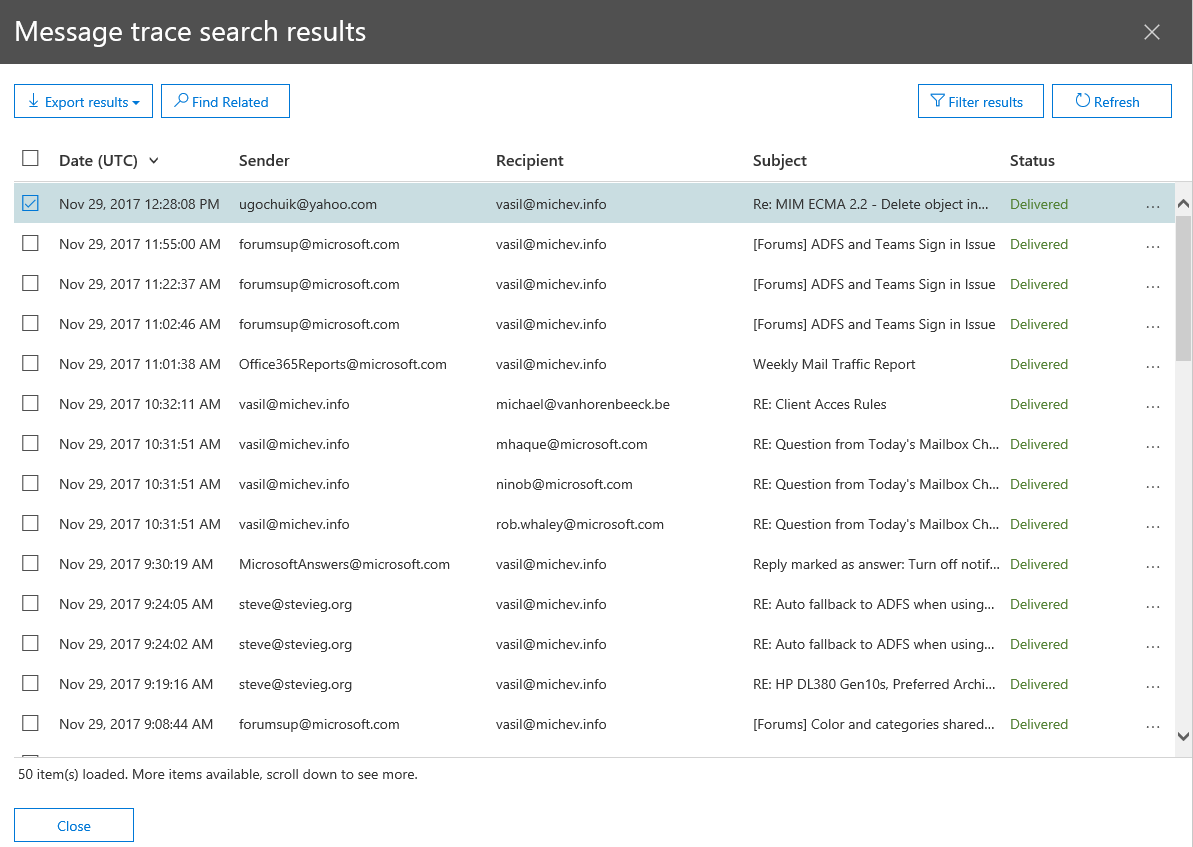
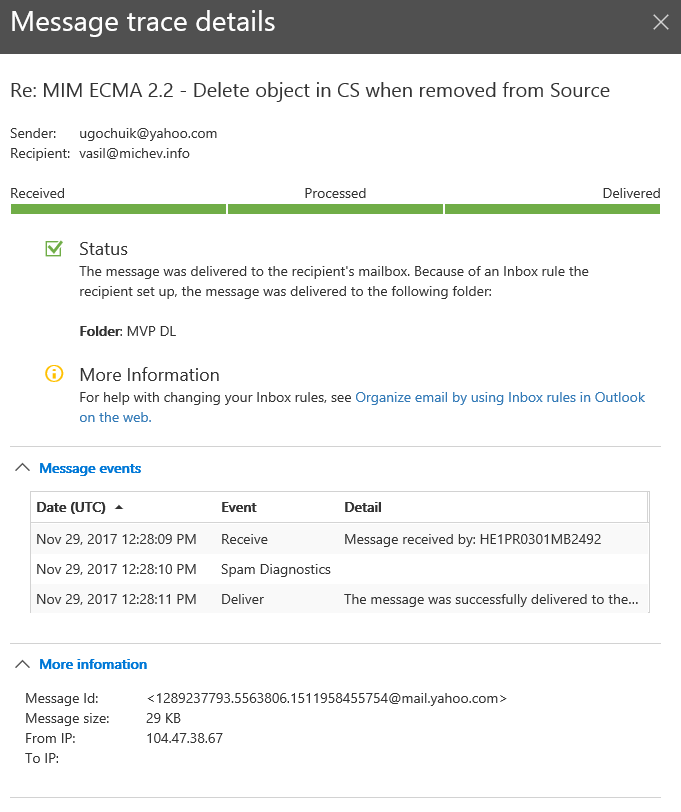
Once you get the list of results, you can click on any message to get the “detailed” message trace, i.e. the info that you would get by running the Get-MessageTraceDetails cmdlet against the message in question. It’s all available in the UI now and prettified with the new “joyous NDR” look and feel, which makes it that much easier to understand what’s going on. Additional insights as to forwarding, spam processing or mailbox rules that affected the message are all shown here.
Some other UI improvements are immediately visible. Color coding based on the message status is used, making it easier to spot any failed or delayed messages. The Export button allows you to export a list of all or selected messages to a CSV file. To help you select just the right messages, a new client-side filtering functionality is exposed, via the Filter results button. The Find related button makes it very easy to run a trace based on specific messageID – select the message in question and press the button to return all other messages with the same ID. Another improvement is the option to select the timezone in which to display the results, you can configure that by using the “custom” Time range control.
For additional details make sure to watch the hands on demo here:


